What Makes Python a Great Pick for Data Analysis?
What Makes Python a Great Pick for Data Analysis?
As per Statistica, the big data and business analytics global market was valued at $168.8 billion in 2018 and is projected to grow to $274.3 billion by 2022. Such rapid growth in data analytics is not a surprise. It is becoming a great resource for businesses to have better business decisions, predict customer needs, target personalized approaches towards customers, and avoid major failures.
The growth and popularity of data analytics are on exponential growth and companies are actively getting involved with it. If we look back to 2015, there were just 17% of companies involved in big data analytics. But that number raised to 53% by 2017, and it is increasing with every passing year.
To become a part of leading companies that utilize data analytics, you should have a solid grip on at least one programming language that is used in data science. One of the widely used programming languages is Python, known for being easy to learn, flexible, strong community, and plenty of other benefits.
In this article, we will have a closer look at the Python programming language, how to use it for data analysis, its pros & cons, and similar other factors. So, let’s get started!
Is Python “The” Programming Language for Data Analysis?
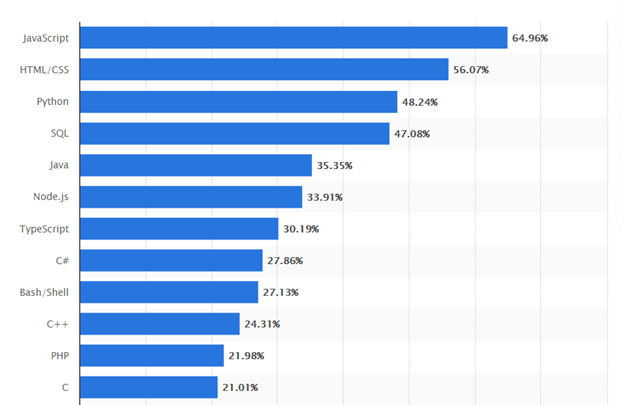
Python took its first steps in the programming world in 1990, but the actual popularity around it started just a few years back from now. Today, it stands as the 3rd most widely used programming language in the world with around 48.24% of developers using it. The rapid growth around Python is already projecting it to take over the first position in just a matter of time.

Fig 1. Most used languages by worldwide developers 2021. Source: Statista
Python is a high-level, general-purpose, interpreted programming language using the object-oriented approach. It is widely used for the Internet of Things (IoT), Artificial Intelligence (AI), web development, API development, and similar other development applications.
One of the major reasons behind Python’s rapid popularity is its excessive use by data scientists. Not just it is easy to learn, but the rich set of libraries make it work smoothly for different simple to complex data science project stages. So, it would be a big YES that Python is the programming language for data analysis. Now let’s jump into how Python assists data analysis.
Python Application is Data Analysis
Python fits well in all the stages of data analysis. Its specific data science libraries are what make it highly useful for data analytics. However, there are three main areas in data analysis where Python is most widely used, i.e., data mining, data processing & modeling, and data visualization.
Data Mining
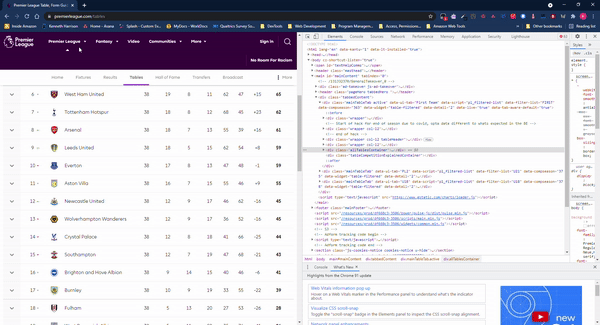
Python libraries, such as Scrapy and Beautiful Soup, are used by data engineers for data mining purposes. Scrapy is commonly used for gathering data from APIs. With the use of Scrapy, data engineers can develop programs that work specifically to collect web data. On the other hand, Beautiful Soup is helpful if data cannot be gathered from APIs. So, Beautiful Soup assists by scraping data and then arranging it in the required format.

Fig 2. Web Scraping with Python and Beautiful Soap. Source: Python in Plain English
Data Processing & Modeling
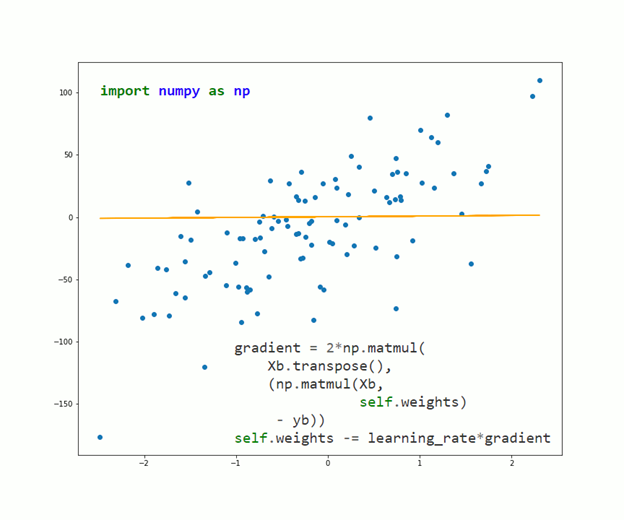
For data processing and modeling, two Python libraries are commonly used, i.e., NumPy and Pandas. Numerical Python (NumPY) facilitates arranging big data sets and makes it easier to do math functions and their vectorization on arrays. On the other hand, Pandas facilitates with two data structure types: data frames (multiple columns table) and series (items in list form). It turns data into a data frame, thereby empowering data engineers to add/delete columns or conduct other operations.

Fig 3. Linear Regression in NumPY. Source: Towards Data Science
Data Visualization
When it comes to data visualization, Python Seaborn and Matplotlib are the most commonly used libraries in Python. They are a great resource for converting lengthy, complex lists of numbers into reader-friendly graphics, heatmaps, pie charts, histograms, etc.
Other than the above-mentioned libraries, Python has tons of other libraries to offer. In short, Python libraries and tools are well-equipped to serve all the needs of data analysts during every stage of the data analysis project.
Fig 4. 3D Surface Plot in Python. Source: Python Matplotlib Tips
Pros & Cons of Python for Data Analysis
Every programming language has some pros and cons associated with it. If one language is good at handling big data faster, then the other one would be much better at data visualization. In fact, picking up a programming language for data analysis depends on what features the data analyst wants the most from the language. Below we have listed some of the pros and cons of Python.
Pros of Python for Data Analysis
Python widespread use and global popularity are because of tons of benefits it offers to data analysts, as follow:
- Easiest Language to Learn: In the programming world, Python is known as one of the easiest languages to learn. It is mainly due to its smooth readability, clear syntax, and fewer lines of coding. Due to being easy to learn, it makes development faster. Developers can write at a faster pace without facing serious complications, while the code also becomes easier to debug. In short, anyone can quickly skill up in Python and start doing data analysis projects.
- Diversified Libraries: As narrated above, another major reason for Python’s popularity is its wide range of libraries that assists data analysts in all the data analysis stages. In addition, the libraries are free to use and the strong community support is making them evolve and offer more features.
- Strong and Massive Community: The early era of programming for difficult, while the programming languages were also complex and hard to learn. But programming has become a lot easier today with the growing “community” culture. Being one of the most widely used programming languages, Python holds a massive community of Python developers and a large number of repositories in GitHub. So, a Python developer can easily and quickly find a solution to the problems with the help of the active Python community.
- Scalable & Flexible: Python can be deployed in a number of app development tools and works efficiently owing to its hyper flexibility. That’s why Python finds application in diversified projects and fields.
Cons of Python for Data Analysis
Although Python acts as a one-stop language to fulfill data analysis needs, still there is one specific con that slightly impacts its data analysis application, as follow:
- Dynamic Typing: Being a general-purpose language, Python is not solely developed for data analysis. It is being actively used for web development, app development, and software development. Due to dynamic typing, it is much easier and faster to do development with Python. But it is also a disadvantage for data analysts, as it makes it much complicated to search difficult tracked errors that are caused by misassigning different data to the same variable.
Wrapping Up
To gain a competitive edge, offer personalized services, and ensure better decision-making, data & its analysis is the key to achieving all such targets. Today, you will find many programming languages for data analysis, such as Scala, Julia, SQL, R, JavaScript, and many more. Every language offers something special than the other ones. So, we cannot declare any one language as the ideal language for data analysis.
However, Python stands as the most popular, easiest to learn, and widely-used programming language for data analysis. With its diverse libraries, it facilitates data analysts in every state of data analysis. In addition, the active community is always available for quick assistance in case of any troublesome situation.
Data analysts is a promising career and having a solid grip in Python can open doors of career opportunities in big companies. So, if you want to become skilled in data analysis with Python, join our online course and elevate your skillset and CV.

